Commercial real estate investment trends were positive in 2014, following on last year’s tail winds. Sales of large CRE transactions (LCRE)—over $2.5M—advanced 21 percent year-over-year in, totaling $438 billion, based on Real Capital Analytics (RCA) data. The investment trends continued apace in the first quarter 2015, totaling $129 billion, a 45 percent increase from the same period in 2014.
Investor demand for properties continued on an upward path, as economic fundamentals, broadening lending sources and capital followed returns. With global economies moderating in 2014, the U.S. property market became an even stronger contender for cross-border investors, as well. Secondary and tertiary markets remained on the list of investor destination due to higher yields. However, top markets returned to the forefront as capital sources consolidated in pursuit of top-tier properties.
In comparison to the high-end deals, 86 percent of commercial REALTORS® posted transactions below the $2.5 million threshold in 2014. Although many REALTORS® participate in transactions above $2.5 million per deal, they serve a segment of the commercial real estate market for which data are generally not as widely reported, which we term the small CRE transactions (SCRE).
Based on National Association of REALTORS® (NAR) data for the SCRE market, sales volume increased 35 percent on a yearly basis in 2014. The strong increase mirrored the renewed investor interest in stable market and properties offering higher yields.
Prices for REALTORS® commercial transactions advanced 8 percent year-over-year in 2014, a much slower pace than in LCRE transactions. Cap rates averaged 8.1 percent over the year, a 40 basis point decline from 2013. Yields in SCRE markets continued to offer a premium compared with the 6.8 percent average recorded in LCRE transactions during 2014.
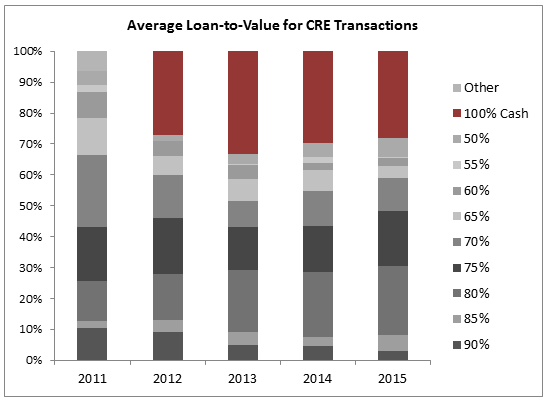
While lending conditions eased in 42 percent of REALTORS markets, financing remained a major concern. For 59 percent of members, the average transaction’s loan-to-value (LTV) was 70 percent or higher, with 31 percent of total deals posting LTVs of 80 percent or above. Just as importantly, cash deals comprised 28 percent of all transactions. While the figure represents a decline from 2014, it has hovered around the 30 percent mark for the past four years.
(Click to enlarge photo)
In LCRE markets, national banks provided the bulk of debt financing, actively competing with government sponsored enterprises, CMBS conduits and life insurance companies. However, in SCRE markets, where many commercial REALTORS® are active, regional and community banks were the largest lending group, making up 58 percent of transactions.
The lending survey highlights the marked differences in the LCRE markets versus the SCRE markets. Debt financing represents a much-larger portion of capital in SCRE markets, whereas LCRE deals benefit from significant equity contributions.
For commercial REALTORS®, 42 percent of transactions failed due to lack of financing, mostly on account of stringent loan underwriting standards. With higher costs of compliance and higher capital reserve requirements for CRE loans, regional and community banks have shouldered a proportionally larger share of the costs, leading to more cautious lending activity. In 2014, 22 percent of REALTORS® reported tightening lending conditions, compared with 28 percent in 2013. While the figure points to an improving capital market, the pace and volume remains slower than for LCRE markets.
By: George Ratiu (Economists’ Outlook)
Click here to view source article.
Commercial Association of REALTORS® - CARNM New Mexico
Commercial Transactions in REALTOR® Markets
06.09.2015

© 2026, Content: © 2021 Commercial Association of REALTORS® New Mexico. All rights reserved. Website by CARRISTO