As widespread U.S. vaccinations occur, the Butterfly Recovery of the past year will give way to a new Roaring 20s. It is very difficult to paint a scenario where this boom fails to materialize except if new COVID variants overcome vaccination progress. Individuals (and firms) have built up savings (reserves) and paid off debt, waiting for the opportunity to purchase the experiences (investments) they desire. Bank deposits rose a staggering 22% in 2020 due to widespread involuntary savings and generous government transfer payments. This pent-up demand centers around travel, leisure, and entertainment but also includes items like new clothes and personal care products and services (e.g., skin treatments and hair make-overs). After all, many people are still peacocks. Of course, things will not go back to full speed overnight, but look for an (unsustainable) boom over the next three years.
Resurgent demand will push employment upwards, though this will lag until September 2021 due to unduly sustained federal unemployment benefits for those who would have otherwise earned less than $20-25 per hour. Hiring has been slowed by several million jobs due to Federal unemployment insurance payouts, leaving about half of the unemployed with higher incomes than if they had gotten a job. The breakeven wage is roughly $20 per hour, with notably higher incomes for those previously employed at wages below this level. Those that were never employed are being drawn into employment far more quickly than those who were let go, as they do not qualify for unemployment compensation.
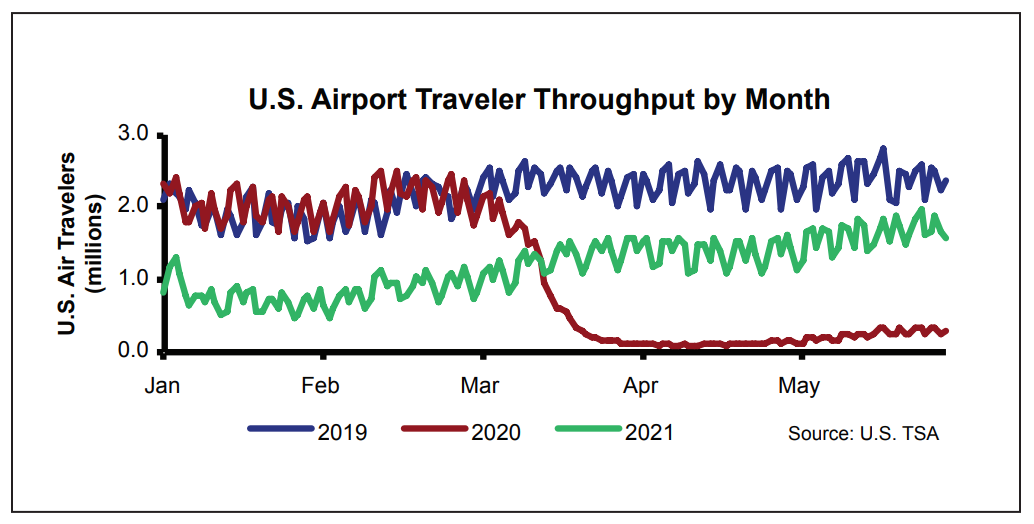
A broad cross-section of sectors is experiencing positive growth. Banks are generally performing well and have massive reserve cushions, which as we predicted, allowed loans outstanding to fall only 1.7% in 2020 despite enormous borrower stress. Meanwhile, airlines are hiring, and U.S. air traveler volume over the Memorial Day weekend was up to 72% of 2019 levels(from a low of 4%). Restaurants added an estimated 830,000 jobs over the last six months through May 2021, but the sector is still 14% below the prepandemic employment level. Google and JP Morgan joined the increasing number of firms saying, “Come back to the office this summer.” Morgan Stanley CEO James Gorman wants employees back in the office by Labor Day, ominously warning that the alternative is “a different kind of conversation,” noting that if employees feel safe in restaurants, they should feel even safer at work. In the U.K., office footfall has already risen to 45% of 2019 levels as people return, and in the U.S., they are up to about 25-30%. Ask yourself why you believe work-from-home is any more productive than virtual education? It is not. It allowed companies to tread water but not to move dramatically forward.
We remind you that as with employment, GDP growth, inflation, and many other aspects of economic performance in 2021 will be highly misleading in terms of “where we are.” Simply stated,
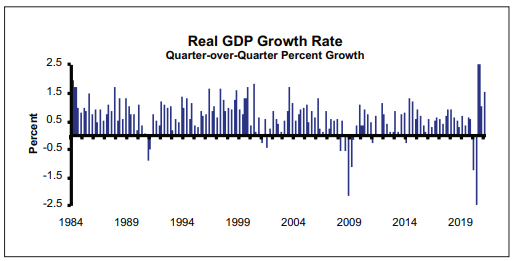
2020 was a bizarre year. After all, on April 20, 2020, the situation was so economically aberrant that the price of oil was negative. Thus, one needs to distinguish whether the quoted growth indicator is reported on a year-overyear, quarter-over-quarter, or annualized quarterover-quarter basis. For example, as the first shutdown ended, there were huge initial drops in both year-overyear and quarter-over-quarter growth rates, especially annualized quarter-over-quarter (which represents the decline that would occur if the quarterly rate prevailed for an entire year). Then, by the latter half of 2020, quarter-over-quarter growth was positive (especially annualized) while year-over-year growth was negative. Caveat emptor always applies to data consumers!
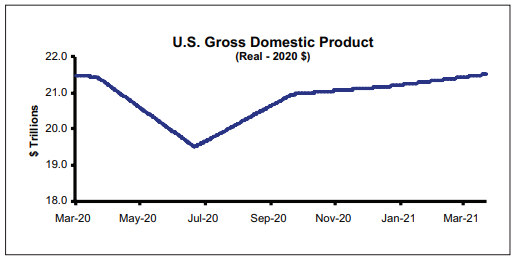
It is best to focus on where things stand versus year-end 2019 for quarterly data and February 2020 for monthly data, as these were the economic high-water marks. Until things normalize, focusing on quarterly and year-over-year gains will provide a distorted view of the economic reality. As the recovery plays out in 2021, large year-over-year growth will be heralded, while quarterover-quarter growth will be much lower. The Butterfly Recovery will end as widespread vaccination occurs and “life” returns. By late 2021, large, annualized quarterover-quarter changes will occur, while year-over-year growth will be modest. As of the first quarter of 2021, real GDP (2020 dollars) and real GDP per capita were 0.9% ($187 billion) and 1.3% ($865) below fourth-quarter 2019 levels, respectively. However, real GDP grew by 1.6% in the first quarter of 2021 and eked out 0.4% growth year-over year. This is welcome news, as it follows three consecutive quarters of negative year-over-year growth. That said, real GDP is still about 3.5% below where it would have been absent COVID. Meanwhile, almost 7.6 million net jobs were officially lost between February 2020 and May 2021, a 5% decrease. This compares to the nearly 22.8 million jobs recovered after the Financial Crisis.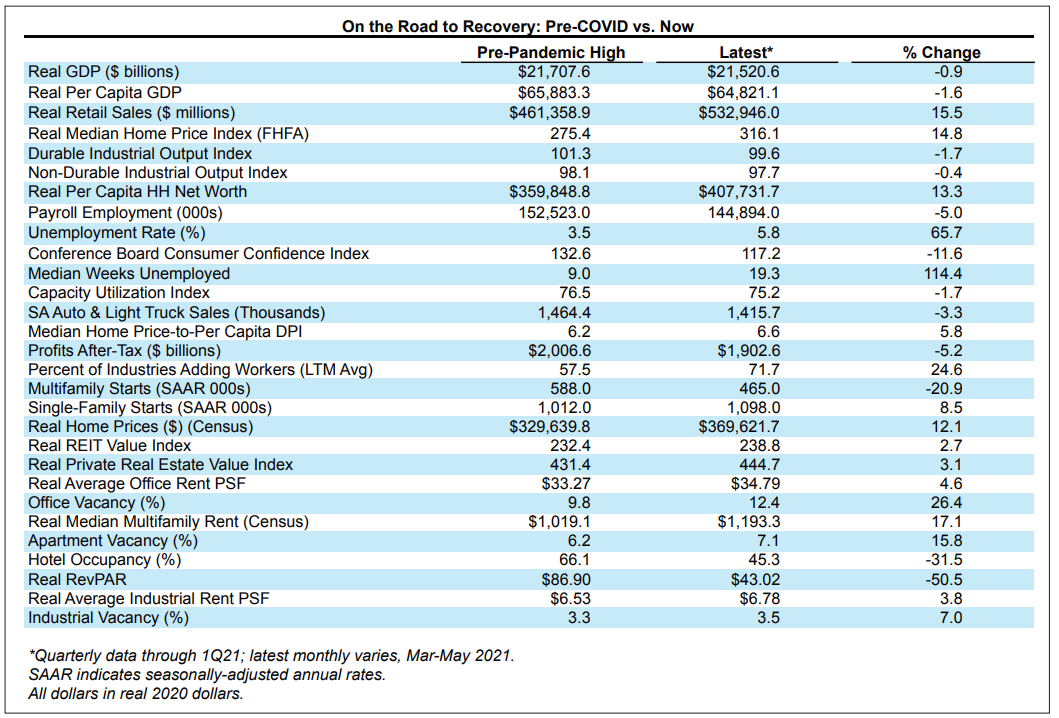
It is essential to remember that this has not been a cyclical recession. Rather, it is a depression brought about by a combination of government mandates limiting economic activity and individual decisions to reduce activity due to COVID concerns. The trajectories of this decline and recovery have nothing to do with cyclical adjustments but rather depend on when governments allow us to do things and when we decide it is safe to do things. This unprecedented trajectory resembled the flight of a butterfly flying uphill until now. We are now (mid-June) at 175 million partially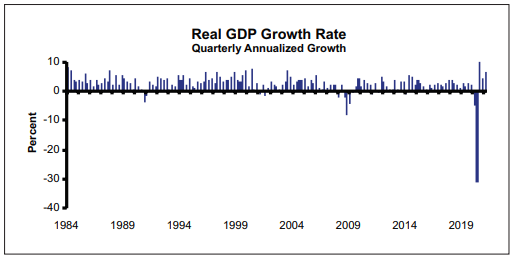 vaccinated (53% of the total population) and 145 million fully vaccinated (44%). As full vaccinations exceed 65% of adults, the Roaring 20s will begin. However, it is unclear whether certain parts of the country will reach this threshold given the large disparity in vaccination rates. As of mid-June, the top five states in the vaccination race were: Vermont (84% of 18+ population with at least one dose), Hawaii (82%), Massachusetts (81%), and Connecticut and New Jersey (each 77%). In contrast, Mississippi (45% of 18+ population with at least one dose), Alabama, U.S. Virgin Islands, and Louisiana (each 47%), and Wyoming (48%) lagged the national average.
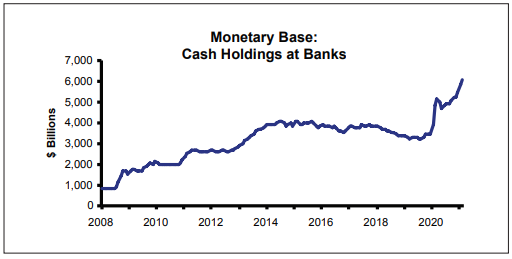
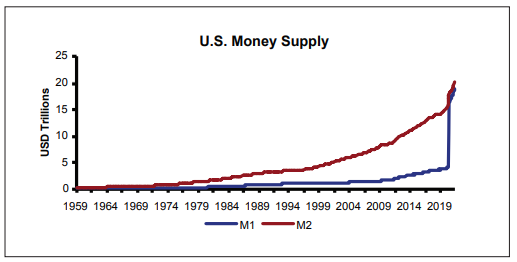
Most observers claim that there was no notable inflation from 2008-2019 even though the Fed increased the monetary base by $3.3 trillion (381%) via QE 1-3. They note that over the last decade, the Consumer Price Index rose by just 1.7% per annum. However, inflation for services and all goods in May 2021 jumped to 3.1% and 4.9%, respectively. In addition, the stock and housing markets displayed notable asset price inflation over the past 12 months. Short-term price pressures exist in many sectors, as many companies quickly reduced capacity as COVID set in. The poster child for this phenomenon is sawmills, where capacity reductions sent lumber prices skyrocketing even as timber remains plentiful. Capacity was slashed 10-40% in many sectors as the COVID shutdown set in, and as demand approaches 2019 levels, price spikes abound. But capacity will revert to 2019 levels over the next 24 months, neutralizing these price spikes. In addition, inflation has occurred in items like hotel rates and airline tickets as demand returns. In short, inflation of these prices has not been an issue when viewed versus 2019.
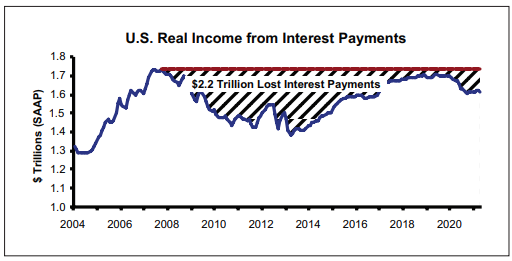
At nearly $1.7 trillion, real annualized personal interest income earned in April 2021 was slightly higher than where it stood a year earlier due to a long overdue (but insufficient) rise in interest rates. While the fed funds rate is still at a historically low level, the 10- year Treasury yield rose by over 100 bps year-over-year through June 2021, to 1.6%. In mid-June, Fed Chairman Jerome Powell described the latest Fed meeting as “talking about talking about (tapering),” raising the prospect that interest rate increases could occur prior to 2023. For now, key interest rates remain near historic lows as central banks soak up debt. Rates will remain low as global monetary authorities (including the Fed) will repress rates to keep government debt affordable. In the near term, this accommodation has little economic cost, but it ultimately crowds out private investment through reduced investment and gives money far too cheaply to the government.
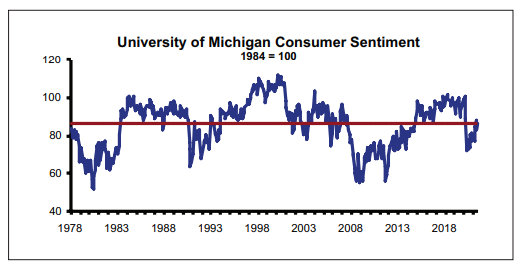
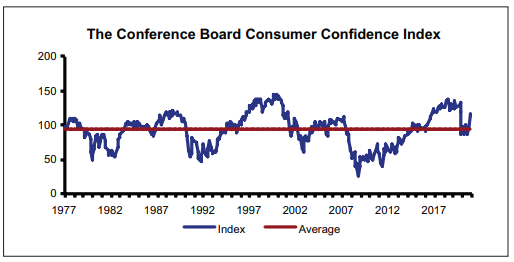
Prior to the pandemic, the Conference Board Consumer Confidence Index stood at 132.6 in February 2020. It dropped to 85.7 in April 2020 and is approaching full recovery, standing at 117.2 in May 2021. The current level is 3,130 bps and 2,290 bps above a year earlier and the long-term average (1977-present), respectively. Similarly, the University of Michigan Consumer Sentiment Index stood at 82.9 in May 2021, 330 bps below the 50-year average of 86.2 but above the 2020 depression low of 71.8. Consumers are dressed up and raring to go.