• Skip to primary navigation
  • Skip to main content

CARNM

Commercial Association of REALTORS® - CARNM New Mexico

  • Property Search
    • Search Properties
      • For Sale
      • For Lease
      • For Sale or Lease
      • Start Your Search
    • Location & Type
      • Albuquerque
      • Rio Rancho
      • Las Cruces
      • Santa Fe
      • Industry Types
  • Members
    • New Member
      • About Us
      • Getting Started in Commercial
      • Join CARNM
      • Orientation
    • Resources
      • Find A Broker
      • Code of Ethics
      • Governing Documents
      • NMAR Forms
      • CARNM Forms
      • RPAC
      • Needs & Wants
      • CARNM Directory
      • REALTOR® Benefits
      • Foreign Broker Violation
    • Designations
      • CCIM
      • IREM
      • SIOR
    • Issues/Concerns
      • FAQ
      • Ombuds Process
      • Professional Standards
      • Issues/Concerns
      • Foreign Broker Violation
  • About
    • About
      • About Us
      • Join CARNM
      • Sponsors
      • Contact Us
    • People
      • 2026 Board Members
      • Past Presidents
      • REALTORS® of the Year
      • President’s Award Recipients
      • Founder’s Award Recipients
    • Issues/Concerns
      • FAQ
      • Ombuds Process
      • Professional Standards
      • Issues/Concerns
      • Foreign Broker Violation
  • Education
    • Courses
      • Register
      • All Education
    • Resources
      • NMREC Licensing
      • Code of Ethics
      • NAR Educational Opportunities
      • CCIM Education
      • IREM Education
      • SIOR Educuation
  • News & Events
    • News
      • All News
      • Market Trends
    • Events
      • All Events Calendar
      • Education
      • CCIM Events
      • LIN Marketing Meeting
      • Thank Yous
  • CARNM Login
  • Show Search
Hide Search

Archives for February 2023

Private Assets Like CRE Can Create a ‘New’ 60-40 Model for Portfolios

February 14, 2023 by CARNM

For decades, many financial advisors have followed a formula for traditional client portfolio allocation which could broadly be described as 60 percent in equities and 40 percent in bonds, otherwise known as the 60-40 model. The rationale was that bonds represented a defensive bucket, while equities gave exposure to higher risk/return potential. Investors could take comfort from having some downside protection on a portion of their assets while benefiting from the upside if riskier assets performed.

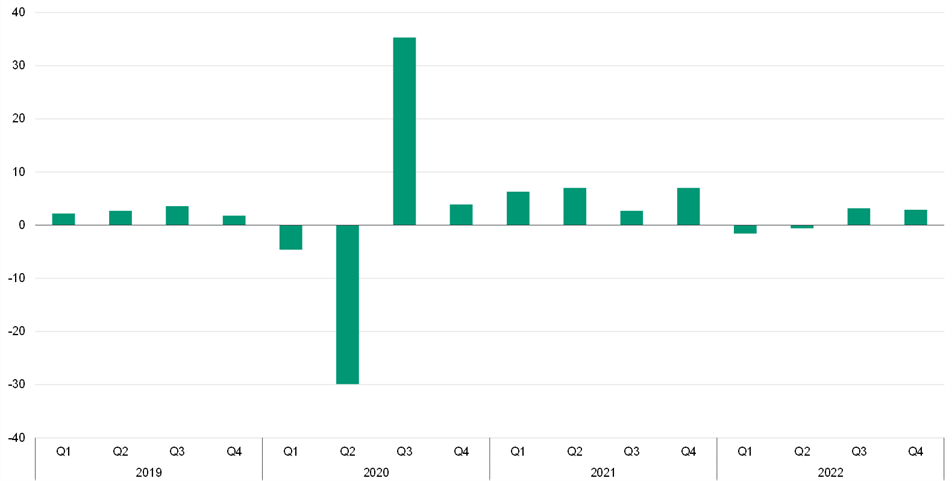
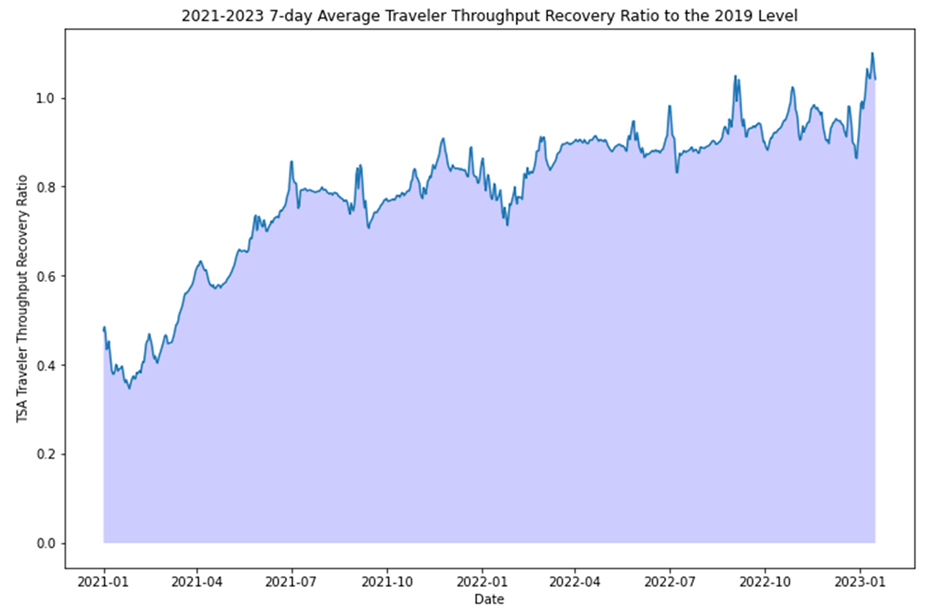
However, as we now know, the performance of 60-40 portfolios last year left a lot to be desired. The Bloomberg Aggregate Bond Index, a key metric for bonds, lost roughly 13 percent for the year, the worst performance since it was established in 1976. The previous worst year had been 1994, when the index dropped 2.9 percent. Never before had that Index and the S&P 500 been down in the same year. The S&P 500 finished 2022 down 19.4 percent.

Why did this happen, and what does it mean for the 60-40 model going forward? Let’s start with the why. The origin of last year’s poor performance in public markets can be traced back to extraordinary action taken by the Fed (and other central banks around the world) in response to the 2008 Global Financial Crisis. In response to the crisis, the Fed tripled the size of its balance sheet almost overnight and took interest rates to zero. Financial Armageddon was avoided, but unprecedented liquidity flowed into the system, which saw many asset prices become inflated and ultimately disconnected from their fundamental value. Cheap and easily available capital encouraged speculation, and the market started overvaluing all assets. Then came a spike in inflation. When it became apparent that inflation was at risk of becoming permanent rather than transitory, the Fed took aggressive action, increasing rates and ending bond purchases in March 2022, with the Fed Funds rate now standing at 4.25-4.50 percent.

The combination of rising rates and liquidity being removed from the system saw the run-up in asset prices we experienced over the last decade start to unwind. In an environment where all asset prices had become inflated, when the music finally stopped, the selloff was indiscriminate and impacted both higher- and lower-risk assets. Hence the 60-40 model performed so poorly.

So, was 2022 the death knell for the classic allocation model?

I would argue that the concept behind the 60-40 model still holds water: Portfolios generally benefit from diversification, so combining core holdings of more defensive assets with riskier investments that help increase total portfolio returns makes sense. However, investors should shift their focus away from just investing in stocks, bonds, and other public-market instruments to allow for an increased allocation to private investments, particularly areas like real estate.

I am not alone in my opinion that private market investing can create a more robust risk-adjusted return for a portfolio than a traditional public-markets-only 60-40 model. Institutional and sophisticated investors, who can be more patient with their capital, have been increasing their allocations to private investments, particularly real estate and private equity, and their performance figures speak for themselves.

Let’s look at university endowments. According to data from MPI, which provides research on institutional asset allocation, endowments saw just a 4 percent drop in returns in their 2022 fiscal years, much better than most benchmarks. The University of Pennsylvania, for instance, posted a flat 0 percent in financial year 2022, which showed that endowment managers were able to protect their fund at a time when public markets had one of their worst performances in recent memory. How did they do it? UPenn had a 2.67 percent return on private equity, with boosts from natural resources and real estate, which offset losses from hedge funds (-2.84 percent) and U.S. equity (-1.95 percent). It was a similar story for Yale, which managed a 0.8 percent return for financial year 2022—again, driven by private market assets.

Of course, private market assets and real estate are marked to market periodically, and the endowments may see losses on some individual assets when they do. That is the nature of investing. Yet, areas like real estate and other private markets can generally weather difficult market conditions better than their more liquid counterparts and over the long run have historically provided higher returns and lower volatility.

So institutional investors are following their own version of the 60-40 model. They are just doing it by increasing their allocation to private assets, such are private equity, real estate, private credit and venture capital. And I believe it is time for financial advisors and investors to consider doing the same thing—a more institutional approach to asset allocating, which means getting comfortable with higher allocations to private market assets.

I know firsthand how passionate financial advisors are about their fiduciary duty. That is why they have historically shied away from recommending alternative investments—they were not well understood and perceived as too high risk for the average investor. However, given the environment we find ourselves in, it is vitally important that advisors start having these conversations with their clients now. Individual investors need to better understand both the risks and the benefits of increasing their exposure to private assets.

Every investor’s needs will differ. But if we want to keep talking about the 60-40 model, we need to start talking about how clients can benefit from incorporating private assets as an integral part of that allocation process.

Source: “Private Assets Like CRE Can Create a ‘New’ 60-40 Model for Portfolios“

Filed Under: All News

Volatility in 2022, Uncertainty in 2023

February 10, 2023 by CARNM

Executive Summary
Economic and geopolitical uncertainty resulted in significant volatility for a wide variety of data points in 2022. Recession probabilities for 2023 remain high not just for the US but for many countries around the world; however, consensus forecasts suggest that most market players expect a relatively short, shallow downturn, with recovery to ensue later this year through 2024. Multifamily, commercial real estate, and housing followed different paths, with some property types having income drivers like rents and vacancies holding steady; while metrics like home prices entered correction territory.


I. Introduction
To say that calendar year 2022 ‘exhibited volatility’ is an understatement: for a host of measures ranging from consumer sentiment, key financial sector metrics, and performance metrics for US commercial real estate and housing – it was nothing less than a roller coaster. Some were not surprises: in late 2021, it was clear that the Federal Reserve was going to tighten monetary policy. Others are so-called ‘black swan events’ – by nature difficult if not impossible to predict – like the impact of the Russia-Ukraine military conflict. What should we expect for 2023? Are we done with the roller coaster ride? Or should we expect to rush back in for another round of high speed camelbacks and inversions, as if we had ‘fast pass’ lane access in an amusement park?


II. The Roller Coaster Ride That Was 2022

Camelback #1: The Real Economy
‘Camelbacks’ represent a hump-shaped hill element found on roller coasters, where you basically go up and down. For US GDP throughout 2022, the first half represented the bottom of the hump, and the latter half offered somewhat of a ride upwards.

Figure 1. Quarterly US Real GDP Growth (Annualized) | 2019 to 2022

Source: Bureau of Economic Analysis

After posting two quarters of negative growth, US real GDP growth turned positive in the third quarter. Advanced estimates released by the Bureau of Economic Analysis (BEA) on January 26 shows that the US economy grew by 1.00% in real (inflation-adjusted) terms for all of 2022 (fourth quarter versus fourth quarter). Given how the BEA tracks GDP, annual 2021 versus annual 2022 actually paints a rosier picture, with the US economy growing by 2.1% net of inflation.

As it turns out, the worst of our fears for 2022 did not materialize. There may yet be a surprise from the National Bureau of Economic Research (NBER), the organization that is responsible for dating the start and end of US recessions. But despite common understanding[1] of recessions being ‘two or more quarters of negative GDP growth,’ it appears that we did not in fact run into a recession in 2022.

Camelback #2: Consumer Sentiment
And yet – very much because of high energy prices driven by the Russia-Ukraine military crisis – consumer sentiment followed a comparable roller coaster path throughout the year.

Figure 2. Index of Consumer Sentiment (1962-2022)

Source: 
University of Michigan Consumer Sentiment Survey, 1962-2022

The chart above shows how the University of Michigan’s Consumer Sentiment index actually hit an historic low in August 2022. According to this metric, US consumer sentiment began turning negative at or around the year prior – July 2021 – following that camelback hump downwards at a steeper rate from March 2022 onwards. The index has been rising since September 2022, right around the time gas prices stabilized.

Inversion #1: Recession Probabilities
‘Inversions’ in roller coasters represent tracks that turn riders upside down before returning them to a upright position. Throughout 2022 recession probabilities across the world have risen (and stayed high). That represents an ‘inversion’ relative to economic growth: we are expecting a much higher risk of contraction for many economies around the world, as opposed to GDP rising.

Figure 3. Recession Probabilities Around The World

Source:
 Moody’s Analytics

Moody’s Analytics estimates that the US sits at a 50 to 65% chance of a recession in 2023. Our baseline forecast is that the US economy will still grow, however, at or around 1.0%. What justifies this relative optimism?

Not-Quite Inversion: Job Creation Trends
Despite headlines of several companies and industries shedding jobs, it does not look like job losses have become systematic. Throughout 2022, job creation has slowed – that is not a surprise when GDP growth shifts from 5.5% from 2021 to 0.91%  in 2022. But it has yet to turn negative – in other words, despite recent announcements from Google/Alphabet, Microsoft, Amazon, and other tech companies about layoffs,[2] it has (as of January 2023) yet to spill over into widespread job cuts across many industries.

Figure 4. Job Creation Trends from 2021 to the Present

Source: Bureau of Labor Statistics

Is that downward trend worrisome? Yes. Statistically speaking, the moment monthly job numbers from the BLS post negatives, there is a 50% chance that a recession has already begun. Consumer sentiment might measure how respondents feel, but once job losses become widespread negative consumer sentiment usually translates into a pullback in consumer spending: you will cut expenses once you’ve lost your source of income.

Still, there appears to be some reason for relative optimism. Job openings are down from recent highs, but one metric suggests that the majority (79%) of workers laid off in the tech industry find jobs within 90 days.[3] Furthermore, a recent survey of CEOs conducted by the Conference Board suggest that despite expectations of a recession in the near term, they are going to try to weather a slowdown without widespread job cuts.[4] If this holds true, then we might just escape a recession.

Potential Inversion: The 10-Year Treasury
As we shift the discussion to commercial real estate and housing, here is a preview of our discussion of CRE capital markets in Section V. The 10-year Treasury, typically used as the benchmark risk-free rate for CRE and housing investments given comparable duration, has been on a generally upward ride since it hit historic lows in mid-2022.


Figure 5. History and Forecasts for the US 10 Yr TSY

Source:
 Moody’s Analytics

The green line to the right of the vertical line labeled ‘Forecast’ shows that we expect the 10-year Treasury to peak at 4.26% later this year, and begin to decline and stabilize. We are expecting to end 2024 at 3.78%, with long term averages at or around 4%.

Downside scenarios are presented in the light and dark blue lines, representing what might happen in a minor downturn and a major downturn (respectively). A minor downturn is a ‘typical’ recession of around six to nine months; a ‘major’ downturn is comparable to the Great Financial Crisis of 2008-2009. It is interesting to note that though we expect rates to fall, we do not expect it to crater below 2.0% – even in a major downturn. This is correlated with the expectation that the Federal Reserve is under pressure to keep rates at elevated levels, even if we encounter a downturn – at least until inflationary pressures truly ease.

But let’s end our discussion of economic prospects on a positive note: for at least this metric, it looks like we have recovered (and even exceeded) pre-pandemic levels.

Figure 6. TSA Traveler Volume (2021-2023, Relative to 2019 Levels)

Source:
 Transportation Security Administration

As of late 2022, the measure above tracking the volume of passengers passing through TSA checkpoints has hovered at or around 95% or more of pre-pandemic averages. We hit a new high of 110% last January 13 (at the very right of this chart). While anecdotal evidence suggests that business travel has yet to truly bounce back, the glass half full perspective of how leisure travel has supported this return to (relative) normalcy – despite higher airfare, driven by higher energy prices – still justifiably represents good news.

In sum, our baseline expectation is that the US economy will grow by 1.0% in 2023, although recession probabilities remain uncomfortably high at 50 to 65%. The past year represented a roller coaster ride for many important metrics – and expect more of the same in 2023 given ongoing uncertainty around the economy and geopolitics.

III. Commercial Real Estate Outlook
In this section we present updated fourth quarter data for the office, retail, and multifamily sectors, along with our current forecasts for 2023.

III.A. The Future of Office Remains Uncertain
The national vacancy rate for office properties rose by 20 basis points in the final three months of 2022, ending the year at 18.7%. It is now higher than prior ‘pandemic highs’ which topped out at 18.5% in the second quarter of 2022. Asking and effective rents barely rose, increasing by 0.3% and 0.1%, respectively, in the fourth quarter. Annual rent growth was positive but middling for 2022, coming in at 1.8% and 1.7%. Since these are nominal growth rates, inflation-adjusted growth rates are in negative territory.

Figure 7. Office Performance Metrics

Source:
 Moody’s Analytics

The future of the office sector remains decidedly uncertain, given the persistence of hybrid work. We have now gone through several cycles of senior management, all the way up to CEOs of large firms, expressing a desire or intent to bring employees back into the office, but office physical occupancy measures remain below pre-pandemic levels. As of the week of January 11, Kastle data for ten large cities shows average physical occupancy rates of 46.9% – that is not much changed from 2021 and 2022.[5]

Furthermore, if it is true that recession fears remain high and CEOs will choose to eschew widespread layoffs, unused office space is likely to be high on the agenda for employers seeking to manage margins. Moody’s launched a restructuring program profiled in the Wall Street Journal in August of 2022, explicitly aiming to reduce its real estate footprint while expanding lower-cost operational hubs.[6] It expects to result in $40 to $60 million in annualized savings, the majority of which would be invested towards promotions, hiring, and workplace improvements.

If we do enter a recession in the short run, expect more challenges for office properties given these overall trends.

III.B. Retail Rents Rise, Though Vacancies Remain Elevated
Asking and effective rents for neighborhood and community shopping centers both rose by 0.4% for all of 2022, according to the latest data up to and including the fourth quarter. Vacancies were flat throughout the year, mired at a relatively elevated 10.3%. This is only 30 basis points below pandemic highs of 10.6%.

Figure 8. Retail Performance Metrics

Source:
 Moody’s Analytics

While the ‘death of brick and mortar retail’ has not quite materialized, it is also true that the property type is still heavily affected by the shift towards online channels. Moody’s Analytics does not expect much of a recovery, therefore, over the medium term, with vacancies trending downwards to 10.0% in 2026.

III.C. Multifamily Performs Well, But For How Long?
By contrast to office and retail, multifamily performance metrics held up remarkably well throughout 2022. The national vacancy rate continued to hover in the mid-4s, anywhere from 50 to 100 basis points below the long run average of between 5.2% to 5.5%. Asking and effective rents rose by an impressive 9.5% and 9.7%, respectively, for all of 2022.

Figure 9. Apartment Performance Metrics

Source:
 Moody’s Analytics

That does, however, represent a climbdown relative to the (admittedly record) highs from 2021, when asking and effective rents increased by 12.1% and 12.7%. Furthermore, because the property type has held up so well over the last cycle, developers have continued to build – supply growth has been healthy and is projected to continue over the next couple of years. In the face of a slowing economy, rising interest rates, and potentially reduced demand for housing, a large influx of new supply in the near term is likely not going to provide tailwinds for performance metrics like rents and vacancies.

This does not mean that the outlook for housing as a whole is bleak. Demographic trends in the US certainly suggest that the stock of affordable housing is undersupplied. But there are significant headwinds in the short run, because of the overall expectations of elevated interest rates. And this is very much reflected in the single family housing market.


IV. The Outlook for the Housing Market

IV.A. Rising Interest Rates Has Reduced Demand for Homes
Rising interest rates as reflected in rising mortgage rates hammered the residential housing market in 2022. Housing affordability is plummeting, leading to fewer people applying for mortgages. New and existing-home sales are dropping, home builders are bearish and pulling back on construction, and house prices have fallen from their recent peaks.

The rising rate on 30-year mortgages is directly responsible for the decline in the residential real estate sector. Based on Freddie Mac’s primary mortgage market survey, in December the rate averaged 6.36%, more than double last December’s rate of 3.1%. Rates have been steadily climbing throughout 2022 as the Federal Reserve works to get inflation under control leading to a significant decline in house price affordability.

The typical monthly mortgage payment, based on the median home price and a 20% down payment, rose approximately 55% between the third quarter of 2021 to the third quarter of 2022. This is driving a collapse in demand to purchase homes. With mortgage rates exceeding 7% for the first time in two decades in October, and set to remain high, compared to 2021, the housing market will continue to face pressure due to affordability.

Mortgage demand has plummeted over 40% since the beginning of the year and is now below pre-pandemic levels. Since most home sellers are also homebuyers many potential home sellers are locked into mortgages at interest rates that can be less than half of today’s rates. It is now significantly harder for them to afford to move. Potential new-home buyers have not only been hurt by the rising cost of mortgages but have had to spend increasing amounts on rent and other necessities as inflation has risen.

Figure 10. Mortgage Applications Plunge as Interest Rates Rise

Source:
 Mortgage Bankers Association, Freddie Mac, Moody’s Analytics

As demand has dried up, home sales have followed. Existing-home sales are down nearly 34% compared with a year ago. While new home sales are down 15.3% from a year ago. Falling sales has driven new home inventories up, and now stand at 8.6 month’s supply in September. This has led home builders to become bearish on the market. Both nationally, and for all four reported regions, the NAHB Builders Confidence Index has dropped well below 50.

Figure 11. Builder Confidence Enters Bear Territory

Source:
 US Census Bureau, NAHB, Moody’s Analytics

The collapse in demand and sales is impacting home prices, which were down from summer peaks by over 1% nationally according to the MA HPI. The lower end of the market has been more resilient, barely falling since peaking over the summer compared to a decline of 1.6% for the top third of the market. Lower priced homes are expected to perform better than higher priced homes given underlying demand from young adults and the dearth of supply of starter homes.

IV.B. Home Price Corrections Have Begun, But How Low Will Prices Go?
The Covid-19 pandemic altered consumer preferences for housing.  Combined with historically low mortgage rates, buyers drove up house prices at a record rate, leaving the market more than 25% over-valued relative to its long-run fundamental value. Based on Moody’s Analytics estimates, the national housing market was more over-valued in 2022Q2 than it was during the ’06 Housing Bubble.[7] These valuation levels are not sustainable. Prices are expected to continue to fall 5 to 10% from their recent peaks by the beginning of 2025. The most highly over-valued metro areas will see the largest declines including Boise, Phoenix, Austin and Nashville.

Figure 12. Home Price Correction Has Started

Source: Moody’s Analytics

It is important to note that a 7.5% decline is only a correction and not a crash. House prices will not crater like they did during the Great Recession. We expect that the FHFA purchase-only HPI will fall back to late 2021 levels in early 2025. Only this year’s gains will be wiped out by declines. For perspective: in 2025, when the next low is reached, we expect prices nearly 30% higher than they were at the beginning of 2020.

Figure 13. House Prices Will Continue to Correct

Source:
 Moody’s Analytics

The underlying need for housing remains strong given current demographics, with recent estimates of a 1.5 million unit housing deficit given expectations for household formations and current vacancy rates. [8] Further, despite recent anecdotal evidence of demand destruction through multigenerational and roommate living arrangements, vacancy rates as of November still indicate that inventory is tight.

The following section will end with a short discussion of capital markets for commercial real estate.


V. Quo Vadis, Capital Markets?
Figure 14 below presents our cap rate forecasts for apartment, office, retail, industrial, and hotel properties. Overall, we expect cap rates to increase in 2023 because of upward pressure from rising capital costs, driven by everything we have discussed. With that said, we expect that increases will be more pronounced for property types that are relatively out of favor – like office and retail. Multifamily cap rates will likely also rise, but perhaps not to levels that we expect office and retail cap rates to breach.

Figure 14. Cap Rate Forecasts

Source:
 Moody’s Analytics

What does this all mean for the CRE lending markets? The Mortgage Bankers Association (MBA) released their latest forecasts for origination volume last January 17. Totals for 2022 are still being finalized, but it is likely to have come in at $740 billion, representing a 17.3% decline versus the $895 billion record figure from 2021.

Figure 15. Multifamily and CRE Originations

Source:
 Mortgage Bankers Association, Moody’s Analytics

The MBA expects origination volume to decline by another 5% (to $700 billion) this year. But on a very optimistic note, the MBA then expects originations to rise by a significant number in 2024: that dotted line spikes back up to $885 billion in 2024 (a 26.4% increase versus 2023). That is very close to the record high $895 billion from 2021.


VI. Conclusion
While consensus expectations suggest that 2023 may well be when some form of economic dislocation happens in the US, forecasts suggest that 2024 may mark not just a return to positive growth: for some metrics like multifamily and commercial lending, the recovery may be spectacular. Time will tell whether optimistic or pessimistic perspectives will win out, but what does seem pragmatic is for market players to prepare for continuing uncertainty and volatility in 2023.  The roller coaster ride from 2022 does not appear to be over yet.

Source: : “Volatility in 2022, Uncertainty in 2023“

Filed Under: All News

Volatility in 2022, Uncertainty in 2023

February 10, 2023 by CARNM

Executive Summary
Economic and geopolitical uncertainty resulted in significant volatility for a wide variety of data points in 2022. Recession probabilities for 2023 remain high not just for the US but for many countries around the world; however, consensus forecasts suggest that most market players expect a relatively short, shallow downturn, with recovery to ensue later this year through 2024. Multifamily, commercial real estate, and housing followed different paths, with some property types having income drivers like rents and vacancies holding steady; while metrics like home prices entered correction territory.

I. Introduction
To say that calendar year 2022 ‘exhibited volatility’ is an understatement: for a host of measures ranging from consumer sentiment, key financial sector metrics, and performance metrics for US commercial real estate and housing – it was nothing less than a roller coaster. Some were not surprises: in late 2021, it was clear that the Federal Reserve was going to tighten monetary policy. Others are so-called ‘black swan events’ – by nature difficult if not impossible to predict – like the impact of the Russia-Ukraine military conflict. What should we expect for 2023? Are we done with the roller coaster ride? Or should we expect to rush back in for another round of high speed camelbacks and inversions, as if we had ‘fast pass’ lane access in an amusement park?


II. The Roller Coaster Ride That Was 2022

Camelback #1: The Real Economy
‘Camelbacks’ represent a hump-shaped hill element found on roller coasters, where you basically go up and down. For US GDP throughout 2022, the first half represented the bottom of the hump, and the latter half offered somewhat of a ride upwards.

Figure 1. Quarterly US Real GDP Growth (Annualized) | 2019 to 2022

After posting two quarters of negative growth, US real GDP growth turned positive in the third quarter. Advanced estimates released by the Bureau of Economic Analysis (BEA) on January 26 shows that the US economy grew by 1.00% in real (inflation-adjusted) terms for all of 2022 (fourth quarter versus fourth quarter). Given how the BEA tracks GDP, annual 2021 versus annual 2022 actually paints a rosier picture, with the US economy growing by 2.1% net of inflation.

As it turns out, the worst of our fears for 2022 did not materialize. There may yet be a surprise from the National Bureau of Economic Research (NBER), the organization that is responsible for dating the start and end of US recessions. But despite common understanding[1] of recessions being ‘two or more quarters of negative GDP growth,’ it appears that we did not in fact run into a recession in 2022.

Camelback #2: Consumer Sentiment
And yet – very much because of high energy prices driven by the Russia-Ukraine military crisis – consumer sentiment followed a comparable roller coaster path throughout the year.

Figure 2. Index of Consumer Sentiment (1962-2022)

Inversion #1: Recession Probabilities
‘Inversions’ in roller coasters represent tracks that turn riders upside down before returning them to a upright position. Throughout 2022 recession probabilities across the world have risen (and stayed high). That represents an ‘inversion’ relative to economic growth: we are expecting a much higher risk of contraction for many economies around the world, as opposed to GDP rising.

Figure 3. Recession Probabilities Around The World

Moody’s Analytics estimates that the US sits at a 50 to 65% chance of a recession in 2023. Our baseline forecast is that the US economy will still grow, however, at or around 1.0%. What justifies this relative optimism?

Not-Quite Inversion: Job Creation Trends
Despite headlines of several companies and industries shedding jobs, it does not look like job losses have become systematic. Throughout 2022, job creation has slowed – that is not a surprise when GDP growth shifts from 5.5% from 2021 to 0.91%  in 2022. But it has yet to turn negative – in other words, despite recent announcements from Google/Alphabet, Microsoft, Amazon, and other tech companies about layoffs,[2] it has (as of January 2023) yet to spill over into widespread job cuts across many industries.

Figure 4. Job Creation Trends from 2021 to the Present

Is that downward trend worrisome? Yes. Statistically speaking, the moment monthly job numbers from the BLS post negatives, there is a 50% chance that a recession has already begun. Consumer sentiment might measure how respondents feel, but once job losses become widespread negative consumer sentiment usually translates into a pullback in consumer spending: you will cut expenses once you’ve lost your source of income.

Still, there appears to be some reason for relative optimism. Job openings are down from recent highs, but one metric suggests that the majority (79%) of workers laid off in the tech industry find jobs within 90 days.[3] Furthermore, a recent survey of CEOs conducted by the Conference Board suggest that despite expectations of a recession in the near term, they are going to try to weather a slowdown without widespread job cuts.[4] If this holds true, then we might just escape a recession.

Potential Inversion: The 10-Year Treasury
As we shift the discussion to commercial real estate and housing, here is a preview of our discussion of CRE capital markets in Section V. The 10-year Treasury, typically used as the benchmark risk-free rate for CRE and housing investments given comparable duration, has been on a generally upward ride since it hit historic lows in mid-2022.

The green line to the right of the vertical line labeled ‘Forecast’ shows that we expect the 10-year Treasury to peak at 4.26% later this year, and begin to decline and stabilize. We are expecting to end 2024 at 3.78%, with long term averages at or around 4%.

Downside scenarios are presented in the light and dark blue lines, representing what might happen in a minor downturn and a major downturn (respectively). A minor downturn is a ‘typical’ recession of around six to nine months; a ‘major’ downturn is comparable to the Great Financial Crisis of 2008-2009. It is interesting to note that though we expect rates to fall, we do not expect it to crater below 2.0% – even in a major downturn. This is correlated with the expectation that the Federal Reserve is under pressure to keep rates at elevated levels, even if we encounter a downturn – at least until inflationary pressures truly ease.

But let’s end our discussion of economic prospects on a positive note: for at least this metric, it looks like we have recovered (and even exceeded) pre-pandemic levels.

Figure 6. TSA Traveler Volume (2021-2023, Relative to 2019 Levels)

As of late 2022, the measure above tracking the volume of passengers passing through TSA checkpoints has hovered at or around 95% or more of pre-pandemic averages. We hit a new high of 110% last January 13 (at the very right of this chart). While anecdotal evidence suggests that business travel has yet to truly bounce back, the glass half full perspective of how leisure travel has supported this return to (relative) normalcy – despite higher airfare, driven by higher energy prices – still justifiably represents good news.

In sum, our baseline expectation is that the US economy will grow by 1.0% in 2023, although recession probabilities remain uncomfortably high at 50 to 65%. The past year represented a roller coaster ride for many important metrics – and expect more of the same in 2023 given ongoing uncertainty around the economy and geopolitics.

III. Commercial Real Estate Outlook
In this section we present updated fourth quarter data for the office, retail, and multifamily sectors, along with our current forecasts for 2023.

III.A. The Future of Office Remains Uncertain
The national vacancy rate for office properties rose by 20 basis points in the final three months of 2022, ending the year at 18.7%. It is now higher than prior ‘pandemic highs’ which topped out at 18.5% in the second quarter of 2022. Asking and effective rents barely rose, increasing by 0.3% and 0.1%, respectively, in the fourth quarter. Annual rent growth was positive but middling for 2022, coming in at 1.8% and 1.7%. Since these are nominal growth rates, inflation-adjusted growth rates are in negative territory.

Figure 7. Office Performance Metrics

The future of the office sector remains decidedly uncertain, given the persistence of hybrid work. We have now gone through several cycles of senior management, all the way up to CEOs of large firms, expressing a desire or intent to bring employees back into the office, but office physical occupancy measures remain below pre-pandemic levels. As of the week of January 11, Kastle data for ten large cities shows average physical occupancy rates of 46.9% – that is not much changed from 2021 and 2022.[5]

Furthermore, if it is true that recession fears remain high and CEOs will choose to eschew widespread layoffs, unused office space is likely to be high on the agenda for employers seeking to manage margins. Moody’s launched a restructuring program profiled in the Wall Street Journal in August of 2022, explicitly aiming to reduce its real estate footprint while expanding lower-cost operational hubs.[6] It expects to result in $40 to $60 million in annualized savings, the majority of which would be invested towards promotions, hiring, and workplace improvements.

If we do enter a recession in the short run, expect more challenges for office properties given these overall trends.

III.B. Retail Rents Rise, Though Vacancies Remain Elevated
Asking and effective rents for neighborhood and community shopping centers both rose by 0.4% for all of 2022, according to the latest data up to and including the fourth quarter. Vacancies were flat throughout the year, mired at a relatively elevated 10.3%. This is only 30 basis points below pandemic highs of 10.6%.

Figure 8. Retail Performance Metrics

While the ‘death of brick and mortar retail’ has not quite materialized, it is also true that the property type is still heavily affected by the shift towards online channels. Moody’s Analytics does not expect much of a recovery, therefore, over the medium term, with vacancies trending downwards to 10.0% in 2026.

III.C. Multifamily Performs Well, But For How Long?
By contrast to office and retail, multifamily performance metrics held up remarkably well throughout 2022. The national vacancy rate continued to hover in the mid-4s, anywhere from 50 to 100 basis points below the long run average of between 5.2% to 5.5%. Asking and effective rents rose by an impressive 9.5% and 9.7%, respectively, for all of 2022.

Figure 9. Apartment Performance Metrics

That does, however, represent a climbdown relative to the (admittedly record) highs from 2021, when asking and effective rents increased by 12.1% and 12.7%. Furthermore, because the property type has held up so well over the last cycle, developers have continued to build – supply growth has been healthy and is projected to continue over the next couple of years. In the face of a slowing economy, rising interest rates, and potentially reduced demand for housing, a large influx of new supply in the near term is likely not going to provide tailwinds for performance metrics like rents and vacancies.

This does not mean that the outlook for housing as a whole is bleak. Demographic trends in the US certainly suggest that the stock of affordable housing is undersupplied. But there are significant headwinds in the short run, because of the overall expectations of elevated interest rates. And this is very much reflected in the single family housing market.


IV. The Outlook for the Housing Market

IV.A. Rising Interest Rates Has Reduced Demand for Homes
Rising interest rates as reflected in rising mortgage rates hammered the residential housing market in 2022. Housing affordability is plummeting, leading to fewer people applying for mortgages. New and existing-home sales are dropping, home builders are bearish and pulling back on construction, and house prices have fallen from their recent peaks.

The rising rate on 30-year mortgages is directly responsible for the decline in the residential real estate sector. Based on Freddie Mac’s primary mortgage market survey, in December the rate averaged 6.36%, more than double last December’s rate of 3.1%. Rates have been steadily climbing throughout 2022 as the Federal Reserve works to get inflation under control leading to a significant decline in house price affordability.

The typical monthly mortgage payment, based on the median home price and a 20% down payment, rose approximately 55% between the third quarter of 2021 to the third quarter of 2022. This is driving a collapse in demand to purchase homes. With mortgage rates exceeding 7% for the first time in two decades in October, and set to remain high, compared to 2021, the housing market will continue to face pressure due to affordability.

Mortgage demand has plummeted over 40% since the beginning of the year and is now below pre-pandemic levels. Since most home sellers are also homebuyers many potential home sellers are locked into mortgages at interest rates that can be less than half of today’s rates. It is now significantly harder for them to afford to move. Potential new-home buyers have not only been hurt by the rising cost of mortgages but have had to spend increasing amounts on rent and other necessities as inflation has risen.

Figure 10. Mortgage Applications Plunge as Interest Rates Rise

As demand has dried up, home sales have followed. Existing-home sales are down nearly 34% compared with a year ago. While new home sales are down 15.3% from a year ago. Falling sales has driven new home inventories up, and now stand at 8.6 month’s supply in September. This has led home builders to become bearish on the market. Both nationally, and for all four reported regions, the NAHB Builders Confidence Index has dropped well below 50.

Figure 11. Builder Confidence Enters Bear Territory

The collapse in demand and sales is impacting home prices, which were down from summer peaks by over 1% nationally according to the MA HPI. The lower end of the market has been more resilient, barely falling since peaking over the summer compared to a decline of 1.6% for the top third of the market. Lower priced homes are expected to perform better than higher priced homes given underlying demand from young adults and the dearth of supply of starter homes.

IV.B. Home Price Corrections Have Begun, But How Low Will Prices Go?
The Covid-19 pandemic altered consumer preferences for housing.  Combined with historically low mortgage rates, buyers drove up house prices at a record rate, leaving the market more than 25% over-valued relative to its long-run fundamental value. Based on Moody’s Analytics estimates, the national housing market was more over-valued in 2022Q2 than it was during the ’06 Housing Bubble.[7] These valuation levels are not sustainable. Prices are expected to continue to fall 5 to 10% from their recent peaks by the beginning of 2025. The most highly over-valued metro areas will see the largest declines including Boise, Phoenix, Austin and Nashville.

Figure 12. Home Price Correction Has Started

It is important to note that a 7.5% decline is only a correction and not a crash. House prices will not crater like they did during the Great Recession. We expect that the FHFA purchase-only HPI will fall back to late 2021 levels in early 2025. Only this year’s gains will be wiped out by declines. For perspective: in 2025, when the next low is reached, we expect prices nearly 30% higher than they were at the beginning of 2020.

The underlying need for housing remains strong given current demographics, with recent estimates of a 1.5 million unit housing deficit given expectations for household formations and current vacancy rates. [8] Further, despite recent anecdotal evidence of demand destruction through multigenerational and roommate living arrangements, vacancy rates as of November still indicate that inventory is tight.

The following section will end with a short discussion of capital markets for commercial real estate.


V. Quo Vadis, Capital Markets?
Figure 14 below presents our cap rate forecasts for apartment, office, retail, industrial, and hotel properties. Overall, we expect cap rates to increase in 2023 because of upward pressure from rising capital costs, driven by everything we have discussed. With that said, we expect that increases will be more pronounced for property types that are relatively out of favor – like office and retail. Multifamily cap rates will likely also rise, but perhaps not to levels that we expect office and retail cap rates to breach.

Figure 14. Cap Rate Forecasts

What does this all mean for the CRE lending markets? The Mortgage Bankers Association (MBA) released their latest forecasts for origination volume last January 17. Totals for 2022 are still being finalized, but it is likely to have come in at $740 billion, representing a 17.3% decline versus the $895 billion record figure from 2021.

Figure 15. Multifamily and CRE Originations

The MBA expects origination volume to decline by another 5% (to $700 billion) this year. But on a very optimistic note, the MBA then expects originations to rise by a significant number in 2024: that dotted line spikes back up to $885 billion in 2024 (a 26.4% increase versus 2023). That is very close to the record high $895 billion from 2021.


VI. Conclusion
While consensus expectations suggest that 2023 may well be when some form of economic dislocation happens in the US, forecasts suggest that 2024 may mark not just a return to positive growth: for some metrics like multifamily and commercial lending, the recovery may be spectacular. Time will tell whether optimistic or pessimistic perspectives will win out, but what does seem pragmatic is for market players to prepare for continuing uncertainty and volatility in 2023.  The roller coaster ride from 2022 does not appear to be over yet.

Filed Under: All News

Fed Reports Tighter Standards and Weaker Demand for CRE Loans

February 9, 2023 by CARNM

The January 2023 Senior Loan Officer Opinion Survey on Bank Lending Practices from the Federal Reserve has the type of headline results for commercial real estate lending that you might expect: tighter standards and weaker demands across all CRE loan categories.

Those in the industry have reported slowing demand, higher financing costs, tightening standards, and lower leverage for months now. This is a look from the other side.

“Over the fourth quarter, major net shares of banks reported tightening standards for all types of CRE loans,” the Fed wrote. “Meanwhile, major net shares of banks reported weaker demand for loans secured by nonfarm nonresidential properties and construction and land development loans, and a significant net share of banks reported weaker demand for loans secured by multifamily properties. A moderate net share of foreign banks reported tighter standards for CRE loans, while a modest net share of foreign banks reported weaker demand for such loans.”

The survey asked a “special set of questions” about what banks expected to do regarding lending standards, borrower demand, and asset quality through 2023. Depending on the type of loan — construction and land development, nonfarm residential, and multifamily — the net percentage of domestic respondents planning to tighten standards even more for CRE loans varied from the high 50s (multifamily and non-residential) to about 70% (construction and land development).

The net percentage reporting stronger demand for commercial loans in these categories ran from about -50% (multifamily), just over -60% (construction and land development), and close to -70% (nonfarm residential).

A further look into this year came in answers to questions about outlooks for delinquencies and charge-offs. For construction and development loans, 81.8% of banks expected them to remain about the same; 18.2% said they would deteriorate somewhat. Similarly for multifamily, 84.6% said they would remain around current levels and 15.4% said they would deteriorate somewhat. A somewhat more negative view existed for nonfarm nonresidential properties, with only 64.3% expecting the outlook for delinquencies and charge-offs to remain about the same and 35.7% saying they would deteriorate somewhat.

And given the following question — “Assuming that economic activity progresses in line with consensus forecasts, how does your bank expect demand for the following categories of commercial real estate loans from your bank to change over 2023 compared to its current level, apart from normal seasonal variation?” — when it came to construction and land development loans, 10% said strengthen somewhat, 70% said remain unchanged, and 20% said weaken somewhat.

For nonfarm nonresidential properties, 8.3% said strengthen somewhat, 75% expected things to be largely unchanged, and 16.7% to weaken somewhat.

For multifamily residential properties, the answers were 9.1% strength somewhat, 81.8% remain the same, and 9.1% weaken somewhat.

Source: “Fed Reports Tighter Standards and Weaker Demand for CRE Loans“

Filed Under: All News

  • « Go to Previous Page
  • Page 1
  • Page 2
  • Page 3
  • Page 4
  • Page 5
  • Page 6
  • Page 7
  • Go to Next Page »
  • Search Property
  • Join CARNM
  • CARNM Login
  • NMAR Forms
  • All News
  • All Events
  • Education
  • Contact Us
  • About Us
  • FAQ
  • Issues/Concerns
6739 Academy Road NE, Ste 310
Albuquerque, NM 87109
admin@carnm.realtor(505) 503-7807

© 2026, Content: © 2021 Commercial Association of REALTORS® New Mexico. All rights reserved. Website by CARRISTO